This article is more than 1 year old
Roll up for El Reg's 3G/4G MONOPOLY DATA PUB CRAWL
Part one: Measuring how many bars you get in London
How we defined our measurements
With vast amounts of data to trawl through, we needed a "non-engineer friendly" way to present it and one which would show the differences between the networks. It’s all very well saying “you could make a voice call on all of the networks all of the time”, but that doesn’t establish which one is best. Voice is only carried on the 2G and 3G networks, as none of the UK networks offer VoLTE.

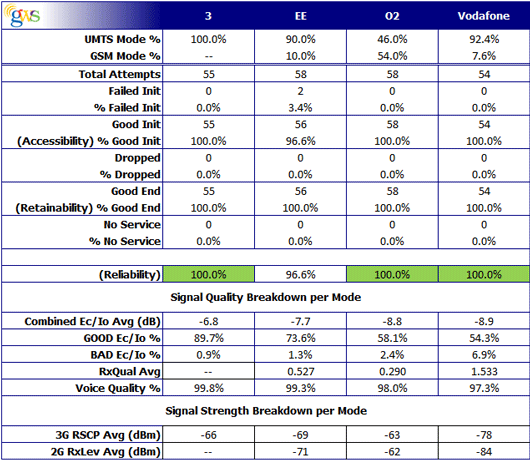
Oxford Street Voice Data
Here is the processed summary data. In this case it’s for Oxford Street but we have similar metrics for all the 28 locations.
A total of 12 Samsung Galaxy S4 phones were used in parallel, with three devices being assigned to each operator as follows: Four were used for voice testing, four were used for 3G-only packet data testing and four were used for 4G-only data testing.
While there is a benefit to testing each operator's highest network technology (ie, 4G LTE), it has been found that the vast majority of users are still on the 3G network. Therefore, the performance of the 3G network must be taken into account.
For voice testing we receive metrics for how often the 3G signal drops back to 2G and show the number of calls made. The data gives us three categories of information: how easy it is to make a call, how "retainable" the call was in terms of not being dropped and how the sound quality is interpreted using Ec/Io. This is a signal-to-noise ratio.
In the data case, we have one device testing the 3G-only network and one testing the 4G-only network. This isn't exactly customer-experience testing, but it does give us a unique performance perspective of each network – and customer experience in terms of throughputs would likely be worse (since a real user would drop down to 2G or 3G, respectively).
Ec/Io is the ratio of a single user's intended signal versus the undesired interference and noise from all sources. Normally, GWS would use MOS (Mean Opinion Scoring) to assess voice quality.
MOS uses the Perceptual Objective Listening Quality Assessment (P.OLQA) algorithm to compare a source reference file against the recorded voice quality on the receiving end. Unfortunately, this requires the mobile device to call a dedicated answering station, which was not available for this test. In lieu of MOS, Ec/Io was correlated to voice quality using years of historic data provided by GWS.
Everything is always a balancing act and it’s one of those art-meets-science things to get right. There is a company called Optulink whose business is built around getting the balance right, which is just about to go into UK trials.

Simon shows how many bars he has
The "engineering way" of measuring signal strength uses dBm as a unit for each value (i.e. -30 dBm). Those values are averages for the whole location and not a percentage of time. The number of houses and hotels is determined by the successful call set up, successful call completion and voice quality percentages.
We measured Accessibility (being able to make a call), Retainability (being able to keep the call active to completion) and Quality (the clarity of the call). Accessibility and Retainability were weighted 50/50 into a Reliability score and the Quality was used separately as another ranking factor.

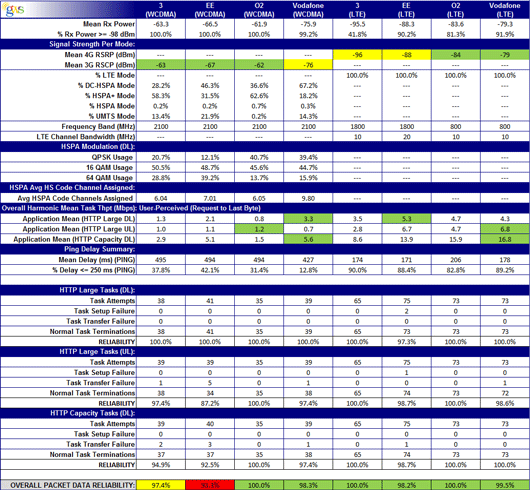
This is the mobile broadband info for Oxford Street
