This article is more than 1 year old
How to catch a fraudster – using 'top cop' Benford and the power of maths
Nothing attracts 'unnatural' numbers like this smooth curve
Random numbers aren't natural... and that's important
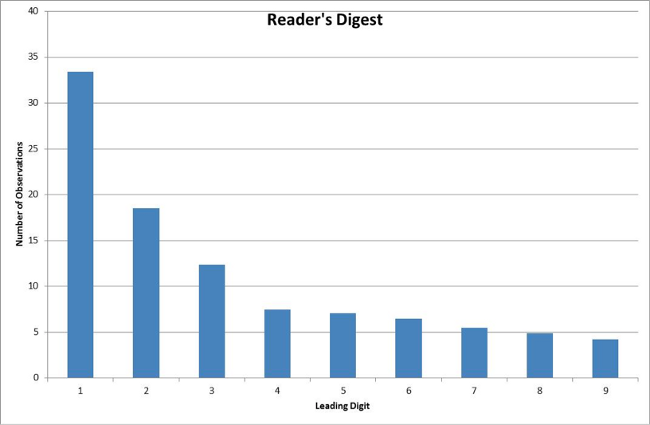
As another example, if you take a copy of a magazine like Reader’s Digest and read it through, noting down every number that is mentioned in the text, a Benford distribution is highly likely to appear before your eyes. Below is some real data collected by Benford himself in 1938 from a copy of Reader’s Digest.
The bottom line is that random numbers don’t follow a Benford distribution but numbers that originate in the real world do. It isn’t an absolute rule, but it is a very good generalisation.
But why? Why on Earth would numbers be distributed like that?
This can be answered mathematically or by trying to give you an intuitive feel for why this happens. I prefer the latter so think about a river. It starts at a spring and runs to the coast so there is a linear distance between the two points. These linear distances will show a flat distribution of leading integers, so, why do real rivers show a Benford distribution?
The reason is that as the water first makes its way to the sea, it hits real world obstacles. Perhaps a big rock around which it has to flow, then later a plain where it meanders. In other words, that original distance inevitably increases with each obstacle and by a different amount each time. The rock makes a very small difference, the plain a much larger one.
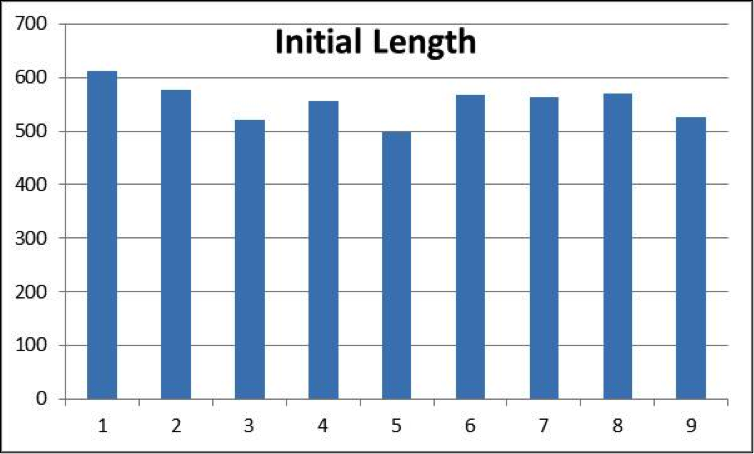
To try to model this we can start with a set of random numbers that represent those initial linear lengths of a set of rivers; the distribution of the leading digits is flat.
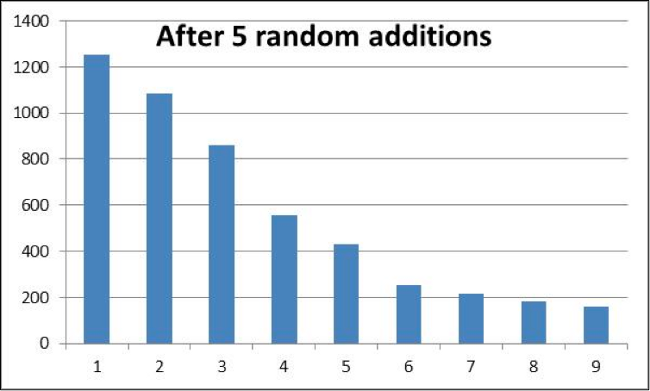
Then we extend the river several times, each extension being a random per cent figure of the length of the river in question. (So, if we apply five extensions, the first might increase the length of the river by four per cent, the next by 17 per cent and so on.) The point here is that values in the wild are the outcome of combinations of factors: invoices are frequently made up of multiple items, plants grow to different heights depending on soil, climate, shelter, disease and so on.
The figures below are the results after five extensions and already we can see a Benford’s distribution.
Of course, we are not trying to model how rivers really form; we are illustrating a more fundamental property of numbers in general. If you make a series of percentage increases (or decreases) to a set of numbers, they will approximate to a Benford distribution.
The reason for this property of numbers is that numbers with different leading integers respond differently when changed in size. For example, if you take a number that starts with a one (say, 100) and make a 20 per cent change to it, then it becomes 120, which still begins with a one. But if you take a number beginning with nine (say, 900), then a 20 per cent change makes it 1,080 – which also begins with a one.
To put that another way:
The number one needs to increase by 100 per cent to become a two, the number five needs to increase by only 20 per cent to become a six and nine requires an increase of a measly 11.1 per cent to become a one. So the proportion of numbers starting with one goes up as we make changes, while the number starting with nine decreases and the rest change proportionately.
So, once you can see the pattern, you realise that Benford distribution isn’t an oddity, it is an inevitability. Is there a good, solid, mathematical underpinning to this?
Of course. Good resources for further study can be found by typing “Benford’s Law” into your preferred search engine and scanning the pages presented for mathematical equations.
But you really don’t need to understand the underlying mathematics in order to use and apply Benford’s Law. You just have to be able to see why the distribution is inevitable.
But what use is this knowledge?
Well, it’s good for fraud detection: you can ask the Arizona State Treasurer if you don’t believe me. In an example cited by accountancy journals for years after, a state employee was found guilty of trying to defraud the State of Arizona of around $1.8m in 1993. The staffer reportedly kept most of the fraudulent transactions just below a $100,000 limit, with an unusually large number starting with sevens, eights and nines. This resulted in a very non-Benford distribution and the example is held up as a classic case study in the effectiveness of using Benford’s to detect accounting fraud.
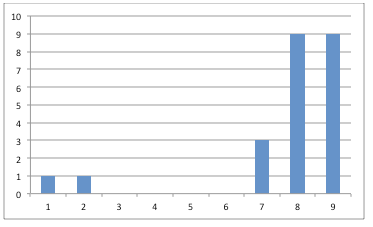
But fraud detection is simply one of many potential uses. Now that you know that wild collected numbers usually show this distribution, you can look for sets of numbers that deviate. For example, a colleague of mine found this leading integer distribution in some direct debit/catalogue payments.
There is no suggestion that this is fraudulent but it did tell him that the matter was worthy of further investigation because “something” is actively responsible for this deviation. And that something might just be the nugget of information that good data scientists are expected to find.
And that is the real take-home message. If you see a Benford distribution, then it really is a case of “move along folks, nothing to see here”. If you see anything else, investigate further. ®


