This article is more than 1 year old
Loads of mis-sold PPI, but WHO will claim? This man's paid to find out
Data mining to fathom the depths of banking's balls-up
Prophecy and loss
For the PPI work, the servers get reloaded every week, but other projects might run daily. If you’re handling historic data, namely decades-old insurance policies, you might ask yourself how fresh data can assist you. Yet for many of the bank's customers, their PPI policy will also have a separate account from the bank attached to it, and this is a rich source of behavioural data. It’s a way of understanding who you are dealing with: are they likely to apply for a PPI refund or will they let it go?
Cole adds: “Recency* is a very important factor when you are analysing data. If you want to figure out what a customer would do in the future, the more recent behaviour is usually a much better indicator of their actions. A lot of the work is about trying to figure out what is going to happen in the future by looking at what happened in the past. That’s a typical domain for data mining and data mining analysts.
"For example, what I’ve also been involved in is to try to figure out if people are likely to default on a loan. So [you] look at a similar group of people, how they’ve behaved in the past and you make your assessment.”
And it is precisely this capacity of big data to reveal the likely actions of vast numbers of customers that the bank has tasked Cole and his colleagues to work with in order to estimate the cost of PPI. If you can determine how certain groups of people are likely to behave then it helps reduce the guesswork involved, so that realistic figures can be delivered that marketeers and investors can swallow.
Cole has his own example of how recency has assisted his PPI work. “In this case, we have figured out the more recent the loan, the more likely there is going to be a mis-selling complaint. So that’s an important driver in order to predict whether there would be a complaint or not.”
But not everyone will complain, so surely the bank can take it in its stride as complaints ebb and flow. Not so: all the banks involved in the PPI scandal have a serious incentive to get these complaints of mis-selling dealt with as quickly as possible, as Cole explains.
“The commercial aspect here is that customers are earning interest on that PPI premium that they’re going to be repaid. So the banks have a vested interest in trying to get these complaints sorted as quickly as possible. They are paying 8 per cent interest.” He adds, jokingly, “If you have been mis-sold, it’s the best savings account you can have.”
Tools of the trade
As data mining continues to grow, many recruitment agencies are now specialising in finding personnel with these skillsets. As you can imagine, how highly sought after you become is driven by the applications you can use and what sort of applications the companies have installed. If there was one application to learn to give you a start in analytic work then Cole suggests you take a look at SAS.“SAS is something that they teach at the university that I went to,” says Cole, “and the company is probably the biggest supplier of statistical analytical software. There are other tools also, but for statistical analysis, you should know it. It involves using standard programming tools, as most of the work is done in programming, and you can build application runs on top of that for other people to use.”
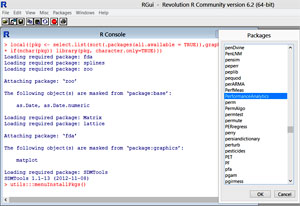
SAS products don’t come cheap and the portfolio covers a huge range of business analytics applications. The site is worth a visit as it features numerous tutorials and the odd demo, but perhaps the best way to get your hands dirty and do some number-crunching is to consider the open-source alternatives such as R from Revolution Analytics. Cole is a fan too.
“I’m also teaching myself R. It is more specifically aimed at statistical analysis and given that it’s open source, anyone can download applications or if they’ve developed one, they can upload it for everyone else to use.”
It’s this aspect of R that appeals to Cole, as it has the potential provide him with a much larger toolset that’s specifically designed for statistical analytics. “In SAS,” he says “the main tools have a lot of functions, but then you have to build your own applications.”
Using Revolution R may well prove to be a useful vehicle for evangelising the benefits of data mining for companies that aren’t permanent members of the FTSE 100, as he explains.
“My initial idea is you would be able to take this type of analytics to smaller companies that cannot afford to invest in the big applications. These businesses have accumulated a lot of data in the last two to 10 years and have their own small big data. Many online companies have a huge amount of behavioural data from customers visiting and shopping on their sites too, but they don’t have the money or the skills to use the data they have collected.”
How these small companies would utilise their data caches remains to be seen but there's no escaping the fact that if you do something that can be logged, then somebody out there will be interested in knowing about it and prepared to pay to find out.
The Community version of Revolution R is freely available for Windows and Red Hat Linux 5 in 32/64-bit flavours. It installed without a hitch on Window 8 running on an Acer Aspire P3 Ultrabook here at The Reg. At a glance, it looks very much like an application that’s designed for people who are well versed in the dark arts of statistical analytics.


