This article is more than 1 year old
Loads of mis-sold PPI, but WHO will claim? This man's paid to find out
Data mining to fathom the depths of banking's balls-up
Feature When the opening line of a conversation starts, “I read an interesting number the other day”, it’s fairly safe to assume that you’re talking to someone whose business it is to know about "interesting numbers". Perhaps unsurprisingly, these words were uttered by an economist whose ability to find god gold in the numbers is the reason why he’s been working for one of those very naughty High Street banks to figure out just how much the PPI scandal is going to cost it.
These days, the banks are very sensitive to any kind of media exposure, which is why this data miner has asked to remain anonymous, so we'll call him Cole.

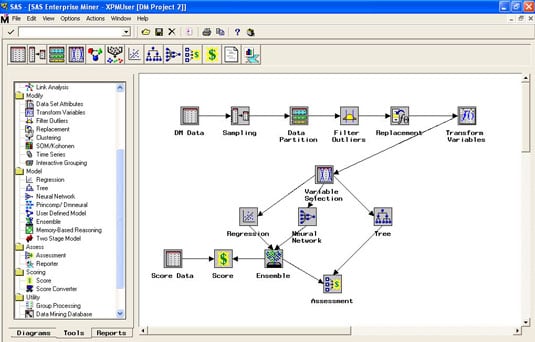
Diamonds in the data: SAS Enterprise Miner tool in use for banking analytics
Click for a larger image
Cole, who has a background in analytics, has to dig into some big data: his client has a hefty slice of those policies to work through, contracts running into the millions.
It's estimated that all the High Street banks combined have 20 million PPI policies to deal with (not all of which will have been mis-sold), but not all of the policyholders are going to play PPI bingo, and that’s the catch. If every case was genuine and everybody applied, all the banks concerned would know what it will cost them straight away.
The fact is, not everyone will be bothered to follow up on compensation for the Payment Protection Insurance they were missold. The mis-selling of said PPI has rocked the banking industry since the major rumblings on this massive financial fiasco began back in 2005. And not knowing what it's going to cost is troubling for the banks. So they're been using data mining techniques to ascertain the types of customer likely to seek compensation to derive more accurate estimates, which is where Cole's expertise comes into play.
Incidentally, the interesting number he was talking about was the statistical claim that, at the moment, 90 per cent of the data stored on servers worldwide was collected within the last two years. In this business, the term "growth industry" appears to be a huge understatement.
Folk record collection
What makes the PPI models rather more involved – as compared to trawling text from tweets and peeking at the contents of your shopping basket – is that the data is historical. It goes back 20 years or more and involves the collation of records that have been migrated from systems long since dead, together with hard copies that have to be scanned in too. Lest we forget, he also needs to consider various bank mergers and their seemingly requisite system incompatibilities along the way. This isn’t the neatly packaged analytics of the today’s e-commerce, it’s a bit of a mess and needs meticulous handling.
So who has been keeping this information? Where does it all live? Just how do you turn up at your desk one day and begin the task of mining data from 20 million records covering two decades?
Cole offers some background to this accumulation of records and its current use today. He sees the arrival of big data as developing in several stages.
“In the 1990s and after the millennium, big data was collated in data warehouses as relational databases. Consultancies earned a lot of money in the 1990s from building data warehouses - collating all transactional data, customer data (all sorts of data). After that came a period where in the last five to 10 years the focus has been more on the applications to utilise almost all of the data. And I come from the applications angle.

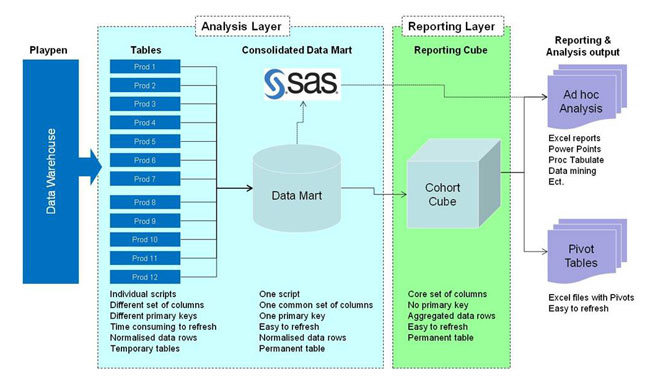
Moving the masses: Data mining information flow chart
"Then the next phase I see, to get to the data-mining part, is the exercise where you get all the data into a format where you can actually start analysing it. Big data, as it is, is not really fit for purpose in terms of getting inside analytics out of it. So analysts tend to build their own data marts on their own computers.”
If you’ve never heard of a data mart before then you’re not alone. Analysts can work from the data warehouse content, but creating a data mart is the way forward: syphoning off an specific range of data and narrowing down the areas you are interested in analysing – for instance, certain companies, time periods or particular regional locations.
There’s direct access to the data on big servers from TeraData and other sources such as Oracle databases and the like and, depending on what it is, several types of data mart are built and, needless to say, the work takes place on copies.
Start with a mart
“We have built a data mart at the bank specifically to cover all the PPI analytics,” explains Cole. “It contains all the bank's PPI accounts that have been sold and all related data to those policies – millions of records. In the data warehouse, there are a lot of data sources – different corporations and all sorts of different data formats coming in. You then collate whatever you need for your particular project or objective. You then build your mart for specific tasks – marts are not permanent.”
The way the data is handled varies between the analytical data and operational phases of the work and the consequently there is the analytical data store (ADS) and also all sorts of operational data stores (ODS). The information in the latter is acted upon and used for various campaigns and targeting specific types of customer. Hence, the final phase is about implementing analytical tools that can make good use of the actual data.
“For analytics, what you’re looking to get is maybe not all of it but definitely the full breadth of the data, so you may not need every single record. Then, when you get to the operational side of things, where you deploy your analytics, you may only need a much smaller part but you will need that for every customer.
"So in terms of the storage with our mart we’ve built here is half a terabyte, and I think we’ve used 95 per cent of that space and there is a upgrade underway. As you can see, it quickly adds up. But analytics is not really so much dependent on size and storage, you can do analytics on small pockets of data, it all depends on what you really want to get out of it.”
