This article is more than 1 year old
Feeling poor? WHO took all your money? NOT capitalist bastards?
Actually it was nurses and firemen and teachers
So why is your pay cheque shrinking?
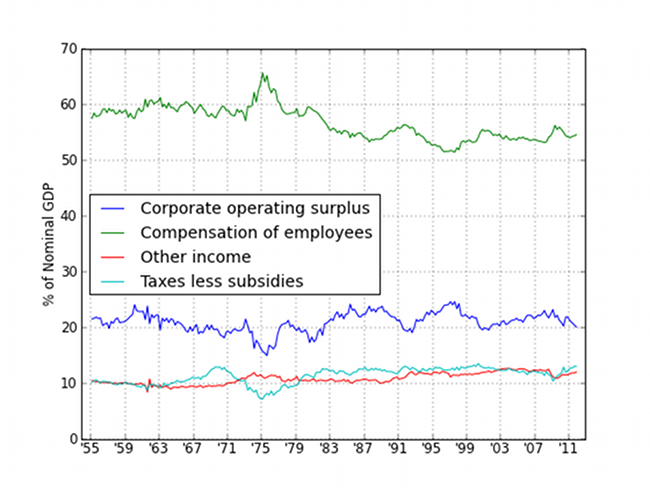
The TUC reckons the 1970s collapse wasn't sustainable. And indeed it was far worse than that chart makes it look. For British industry was quite possibly, as a whole, not making a profit at all at that point. Boohoo for the capitalists you might think, but that profit share also includes all the depreciation we need to save up to replace the machines when they break down. We have to have some profit share for this reason, even if we don't have capitalists.
The problem then was simply high inflation. As a company you're taxed on the difference between your purchase price and your sales price. Which is fine unless you're in a high-inflation environment. When inflation is galloping along at 20 and 30 per cent, the steel you bought six months ago and made into a car is going to generate an amount of "profit" when sold purely from inflation.
You report it as profit and it gets taxed, but you haven't enough money to go and buy new steel to make the next car. This really was a serious problem. Back in the late 1970s, when I started doing economics, a major concern was how to change the definition of profit so as to enable companies to still operate in a high inflation environment. When I came back to the subject in the mid-'80s, everyone had forgotten about it as the inflation had gone away.
So the blip down and back up again is OK. But as you can see there's no real trend since all of that happened. We seem to be pretty much where we have been, on average, for the last half of last century. So what's causing the fall in the labour share?
Mixed income has risen. This is essentially the incomes of the self-employed and unincorporated businesses. It's a long running problem: no one really knows how much of this is labour income and how much capital or profit. Most people who do this sort of work don't know. How much of their income is the time put in and how much is their capital? And if they don't know, then the national statisticians surely haven't a clue. So we just count it separately. And there are more self-employed people around now so it makes sense that a larger portion of GDP is this mixed income.
Then we come to that taxes minus subsidies on consumption bit. Taxes on consumption are essentially sales taxes or VAT. OK, there are some others, insurance premium tax, air passenger duty etc. But the bulk of it, in the time scale we're interested in, is VAT. Which, you might recall, has risen from the 10 per cent introductory rate in 1973 to today's 20 per cent. Yes, that has indeed risen as a percentage of GDP. As can be seen in that little chart 2.
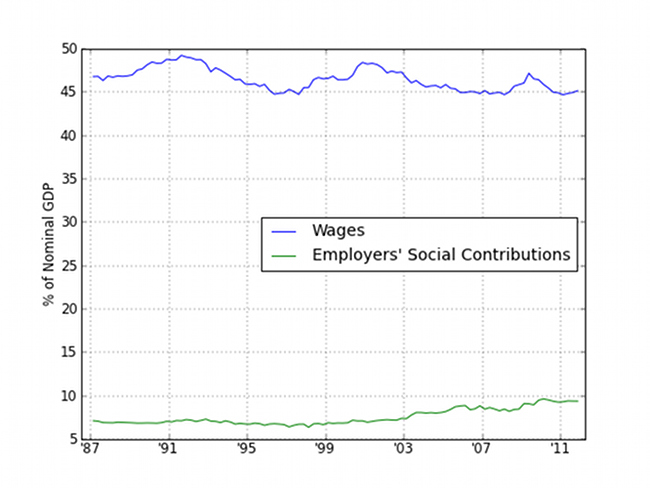
And that little chart 3 is fun too. For as we can see the wages and salaries bit of the labour share has been falling. For employer paid taxes on employment have been rising. That's employer's national insurance in fact. Which has risen from 10 per cent in the mid-70s to the current 13.8 per cent. And, I think I'm right in saying, at some point along the line the upper limit was abolished for employer's NI.
Having laid all of that out (and if there are any readers still here) we can now work out what has really been happening.
Recall, the TUC says that the labour share of income has been falling. Which it has. They then tell us it's the capitalists grinding the workers into the dust. But we've had, corrections from the '70s aside, no rise in the profit share. So why is it that the workers have ever less money?
Inside the labour share, employers now pay more national insurance. This reduces the wages and salaries part of the labour share. With the labour share itself, profit share hasn't risen. Mixed income - the number of the self-employed - has risen, but that's irrelevant to the point the TUC is trying to make. The other thing which explains the falling labour share is the rise in VAT.
So, why have the workers got less cash? Because the government is taking more of it. Far from it being the capitalist bastards pulverising the workers pay cheques, it's government that is doing so to pay for the public sector workers which largely make up the TUC. Which is a lovely outcome of the analysis don't you think? No one would have bothered to look at it all if the TUC hadn't piped up. And really, no one would have, there have been no academic papers on this in decades.
And so to the real point of this piece. This is how you and I are ruled these days. The Robin Hood Tax campaign tells us of all the lovely things we can spend the extra money on: being very quiet about the EU analysis that tells us it will reduce total tax revenues. No, it's not just lefties either. You can see the same sort of statistical holes in the output of MigrationWatch, and sometimes the Taxpayers' Alliance. For the problem is this sort of stuff works. And not just among the general public. The Royal Statistical Society recently reported that only 25 per cent of MPs could work out the odds of getting two heads with two coin flips.
We could call this economic statistics being deployed to make a political point. I prefer to call it government by lying. The sad part being that lying works.
And this is where the tech part works. OK, I've led you through some geekery about economic statistics. But like any experts, all of you can tell when someone on the public stage is spouting bollocks. And that means rather that those of you who do have technical knowledge on any of these subjects about which people are spouting bollocks have to speak up. Otherwise all government will be by lying...
Welcome to the 21st century folks! ®
