Original URL: https://www.theregister.com/2010/05/11/bpi_stats/
Twenty somethings shocker for UK music sales
Despite that, annual BPI survey is surprisingly perky
Posted in Legal, 11th May 2010 12:00 GMT
The UK music industry’s annual statistical bible has been published by the BPI, and it shows how much work it needs to do with music fans. In a nutshell, the business depends on real punters - people who like music enough to actually buy it regularly, and while there were more of them last year, they’re spending less. There are also some surprising results – some positive, but a few shockers. And the survey also stokes the age-old question – who is stingier, Scots or Yorkshiremen?
(The answer is at the end, after a short quiz).
The headline figure for sound recordings income has already emerged: recorded music revenue actually went up in the UK last year, by 1.2 per cent. Since paying for music is effectively optional, this is a healthy figure. And despite a recession, pending remains resilient across class lines, too.
However, the average amount spent on music fell in 2009, to below £60 per person per annum. This figure was £63 per head in 2008. 43.1 per cent of people bought something at least once. From these numbers we see that a majority of people never buy any recorded music, and there’s a large number of low spenders. You can begin to see why the music industry wants to save BBC 6 Music – with its reach, it can help turn casuals into enthusiasts.
The age distribution of spending shows its usual mid-life sag, but amongst teens spending has held up amazingly well, and it’s going up (as Beggars’ boss Martin Mills suggested here last week) amongst older fans. Thanks to the internet, people are finding new music, rather than just listening to the same records they bought when they were students.
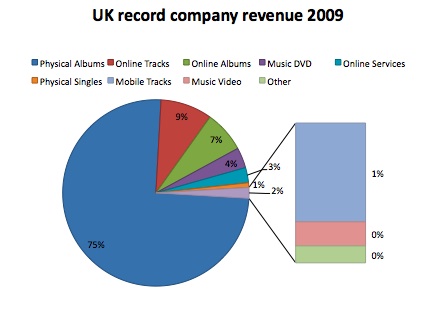
Revenue by format: CDs still rule
Age groups 12-19s and 20-29s spend the most, but this declines until punters reach 50, when their spending perks up again. So 12-19 year olds spent an average of £37.55 (down from £43.23), but 50-59s spent more than in 2008. The shocker is that twenty somethings spent a tenner less per head in 2009 than they did in 2008: 20-29s spent £31.62 on average last year. Barely a quarter of the age group - 27 per cent - bought at least one digital track or album. This a very low number, actually, particularly when we learn (from elsewhere in the handbook) that 68 per cent of the UK listens to music on a computer.
So this scotches one media myth – that internet-savvy teenagers never buy music (and never will). But the decline amongst 20-29s ought to trouble the execs deeply. DRM is long gone from music, most digital albums can be downloaded in a few seconds for under a fiver…. but the age group is spending a tenner less.
There’s no decline amongst the C2 or DE groups worst hit by the recession; DE’s prefer to buy in supermarkets or mail order, but that’s not new.
The CD still carries the industry
CD sales continued to decline, but the big change in the past few years is the rise of the supermarkets. Not one supermarket sold CDs in 2003, now over 3,600 sell music. They account for almost a quarter of CD sales. Competition has seen the retail price of a CD tumble. It was £11.11 in 2000, now it's £7.99, or £7.32 for a single album CD. Half of all CDs retail for less than £8. Tesco's charges an average of £5.10 for a CD, the average price on the interwebs is £7.48, the specialist shops charge over £8 on average. Zavvi and Woolies closed, culling 900 music stores from the High Street. Again, as with 6Music, they catered to mainstream music fans, and a Zavvi offered more choice than a Tesco.
(The rise of the supermarkets also skews the market towards a few hits, not only because the supermarkets like hits and don't like risks, but because their terms put all the risk on the supplier. That's a game only major labels can afford to play).
The numbers also show that home shopping for CDs online, which is never mentioned at “Future of Music” conferences, is quite serious business. Online, iTunes takes 10.6 per cent of digital revenue but Amazon, thanks to home CD delivery, claims 13.6 per cent of online spending. Play.com and HMV's website take 17.5 per cent between them. For digital downloads, Amazon has done very well, and the typical Amazon user is slightly older. The typical iTunes buyer is likely to be in their twenties, Amazon's is higher, in their thirties.
Online shopping, either for downloads or CDs, is skewed heavily towards blokes; but maybe that isn't surprising - when it comes to buying music, at three of the four big supermarket chains, women outnumber men.
Refuting the results of the Government-funded quango Consumer Focus, there was a high recognition of what you can do with a computer to hear music. 83 per cent of people were aware they could hear music via social networks; more than half the survey had heard of Spotify, or used it, which is impressive. Spotify only trickled into the limelight at the start of the year.
Where does our money go?
Major labels took 81.4 per cent of album sales by share. The indies are a broad church: the largest indie is the Ministry of Sound/Hed Kandi label, which pumps out dance compilations, five of which sold over 100,000 copies in 2009. Daniel O'Donnell and Peter Andre are on independent labels...
Urban music makes up 27.5 per cent of digital sales, and 16.5 per cent of dance. Pop accounted for just 2.4 per cent but almost two thirds of all albums sold.
What it takes to get into the singles chart also changes yearly, in unexpected ways. The headline is that that the best-selling single sold fewer copies than ever. The best-seller in 2004 sold 4.1m copies, the best-seller last year shifted just 0.6m in all formats, the lowest ever recorded.
But seven years ago, shifting 2,250 copies in a week would get you into the Top 50. This fell to 1,400 in 2004. Now it’s risen to almost 5,000 a week. This is no ‘Long Tail’, the Tail is the 3m tracks that are never downloaded even once in a year, but it suggests a differently shaped head, if you like.
Anyone want to offer an explanation?
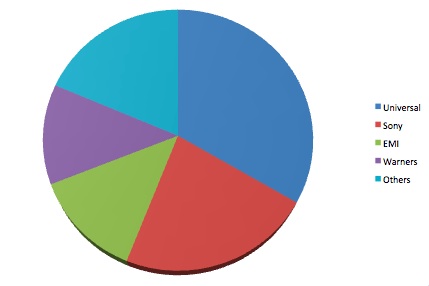
Universal Music Group took 33.4 per cent of the market; while no indie took more than 3 per cent, combined they take third place, with 18.6 per cent
In 2002, the No.1 sold on average 144,300 in a week, while 9,000 would get you in the Top 20. Last year the No.1 sold 92,900 per week on average, but more sales (over 12,000) were needed to get into the Top 20.
We should also note that the cost of the BPI statistical yearbook has risen 7.6 per cent since last year – it’s now seventy quid.
Finally, when analysed by region, some areas spend more than on music than others. The prosperous South East contributes more in revenue than its head count. Yorkshire and the North East contribute less. But Scotland, like London, spends more than average. Insert your favourite stereotype here.
Online piracy isn’t really the focus of the yearbook, but it does include the Harris survey figure that very few people (around 1 in 8) would change their P2P habits if they got a letter explaining legal alternatives. But 46 per cent would, if the ISP warned them of a technical counter-measure was forthcoming. Next year, for 12 months, hundreds of thousands of people (if not more) will receive the slightly pointless “educational” letters. Pointless because the legal alternatives seem to fairly well known, as the BPI agrees, and pointless from the music industry point of view because they don’t seem to discourage legal music consumption. The stamps still cost money, though, the cost to be borne 75 per cent by the music business and 25 per cent by ISPs.®
Bootnote
We should also note that the cost of the BPI statistical yearbook has risen 7.6 per cent since last year – it’s now seventy quid.