Original URL: https://www.theregister.com/2009/03/17/mac_secrets_reverse_engineering/
Reverse engineering Apple's OS X
A thunking good time
Posted in Software, 17th March 2009 18:08 GMT
Mac Secrets A number of folks have asked me what tools and techniques I use to reverse engineer Cocoa executables. I thought it would be worth taking some time out from documenting undocumented APIs to show you how easy it is to do the same thing for yourself.
My number-one favorite tool is class-dump, a command-line utility written originally by Steve Nygard. You can feed an executable to class-dump, and it will print out all the Objective-C class declarations contained within the file. This information alone is often enough to get you started with an undocumented API.
But class-dump is not without its wrinkles. First, you need to be aware that class-dump can have problems with Objective-C 2.0 files. To fix that, there's a variant of class-dump available called class-dump-x. Just search online, and you'll find it. The latest version of class-dump is 3.1.2.
The next problem is that class-dump can get very confused if the executable contains any references to C++ classes, spewing out all sorts of junk to stderr. The workaround is simply to pipe class-dump's output to a file, separating the garbage from the class-declarations you want to see.
Finally, class-dump can get confused by certain "fat" binaries, especially recent ones that contain 64-bit executables. The workaround here is simply to use the lipo or ditto tools to create a single-architecture executable that class-dump will then accept. You can read more about class-dump here.
OK, you've got your class declarations, but you want to look at the code itself, right? Another favorite tool is otx, which you can find here.
You might already be familiar with otool, a command-line utility that's bundled with OS X. otool generates a code disassembly (either PowerPC or Intel) of a specified executable, but the output generated is not very user friendly. otx is effectively an "otool after-burner" that drastically improves the output of otool.
Amongst other things, it annotates the code listing by placing Objective-C style comments alongside method calls. If you're working with C++ code, otx will also try to "unmangle" C++ symbols to their original state. This is very useful when examining certain Apple frameworks such as CoreUI, much of which is implemented using C++. For more on CoreUI, see my earlier article here.
The Wrinkle
There's one wrinkle that you need to be aware of, especially when looking at framework code. In order to implement position-independent code, the GCC compiler implements a "thunking" technique that provides register-based access to global variables, selector strings, and so forth. Thunk calls always occur at the beginning of a method. A typical method prologue might look like this:
+(void)[SomeClass SomeMethod]
0000fa60  55              pushl       %ebp
0000fa61  89e5            movl        %esp,%ebp
0000fa63  57              pushl       %edi
0000fa64  56              pushl       %esi
0000fa65  53              pushl       %ebx
0000fa66  e800000000      calll       0x0000fa6b
0000fa6b  5b              popl        %ebx
If you look carefully at the above, you'll see that the function call at address 0000FA66 simply calls the very next address. In other words, execution continues at address 0000FA6B, but with the same address on the stack.
Popping this return address into EBX gives a position-independent offset that can be used to access global variables. For every EBX-relative data reference in this method (sometimes ECX or even EAX is used), we need to add the "thunk offset" (0000FA6B in this case) to determine the absolute address of the data that's being accessed.
This makes it more tedious to figure out which global variables, string constants or selectors are being accessed. Fortunately, though, otx gets it right much of the time. For those times when otx gets it wrong, I've written a little utility for myself - a kind of otool "after-after-burner" - that processes the output of otx and massages every thunked address reference, so that the absolute address is always shown in the disassembly. It also recognizes and correctly handles old-style thunk calls such as "___i686.get_pc_thunk".

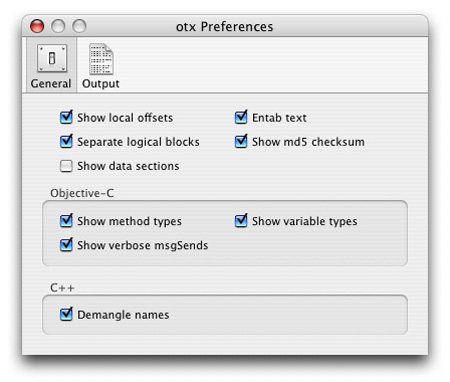
Tick the three Objective-C check boxes when reverse engineering with otx
There's one last weapon in my reverse-engineering armory that definitely deserves a mention, and that's IDA Pro. Currently available here, IDA Pro is a sophisticated multi-processor disassembler that's equally at home munching away at x86 code (my preferred MO), PowerPC or even iPhone ARM executables. Using the output of IDA Pro, it's very easy - for example - to see how a specific function call is actually implemented inside some external dylib or framework.
With all these tools in your arsenal, reverse engineering Cocoa executables is actually very simple. In fact, it's a good deal more straightforward than most Windows executables, with the exception of Delphi and .NET where - like Cocoa - a good deal of runtime type information is contained within the executable. ®