Original URL: https://www.theregister.com/2008/11/17/mac_secrets_graphkit/
Hidden recipes for OS X charts and graphs
Get behind Activity Monitor
Posted in Software, 17th November 2008 06:02 GMT
Mac Secrets One of the many secrets hidden away inside OS X is a private undocumented library called GraphKit.framework. Despite being private, the name is familiar to many Mac developers - and for all the wrong reasons.
Some while back, Apple accidentally introduced a bug into the Xcode 2.1 uninstaller software: If you chose to uninstall this version of the developer tools, the GraphKit.framework library got blown away too.
This wouldn't have been a problem, except for the fact that Activity Monitor won't run without GraphKit.
So what's the GraphKit framework, and why should you care? In essence, GraphKit is a fairly simple graphing library designed to display pie charts, column graphs, X-Y plots, and more. There's nothing to stop you using it in your own programs, aside from the usual caveats regarding undocumented features.
As mentioned, GraphKit is used by Activity Monitor: It's responsible for familiar favorites such as the disk-usage pie chart and scrolling network traffic display. Admittedly, these graphs don't look particularly wonderful. That's largely due to the very small size of the graphs as they appear in the program.
To make use of GraphKit, simply drag the framework in the usual way from the PrivateFrameworks system directory into your Xcode project. Once you've done that, you can fire up Interface Builder and add a custom view to your window. Set the class name of the custom view to GRChartView. This is a descendant of NSView that implements all the graphing rendering.
A GRChartView object has two outlets, delegate and dataSource, which need to be hooked up to the controlling object. In this month's sample project at the end, I've done this in the NIB. However, you could obviously do it programmatically, even creating the GRChartView "on the fly" if wished:
GRDataSet * dataSet = [[[self dataSetClass] alloc] initWithOwnerChart: _chartView];
[dataSet setProperty: [NSNumber numberWithInt: 1] forKey: GRDataSetDrawPlotLine];
[dataSet setProperty: [NSNumber numberWithInt: 90] forKey: GRDataSetPieStartAngle];

[_chartView setProperty: [NSNumber numberWithInt: 0] forKey: GRChartDrawBackground];
[_chartView addDataSet: dataSet loadData: YES];
[dataSet release];
Once you've got this far, you need to create a dataset object (GRDataSet) and associate it with the chart view. This is done by the first line of code in the above code snippet. It's worth pointing out that - if wished - you can add multiple datasets to the same chart view. For example, in the Activity Monitor, the network-traffic chart simultaneously displays either packets in/out or data in/out. The "in" and "out" parts are distinct datasets.
One rather irritating aspect of GraphKit is that what you'd expect to be properties are all implemented via a dictionary based mechanism. Thus, in the above code, we've specifically told the dataset to use plot lines via the GRDataSetDrawPlotLine key. Actually, this property is "on" by default, but I've included this code for illustrative purposes.
The next statement sets the starting angle for a pie chart, and so on. If I were going to really be using GraphKit in anger, I'd probably spend a couple of hours adding some Objective-C 2.0 properties to these classes. It would sure reduce wear and tear on my keyboard.
Finally, the code tells chart view not to display its background and adds the dataset to the chart. After this, the dataset can be released because the GRDataSet object is retained by the chart.
Delegate responses
The delegate is expected to implement a few selectors, the prototypes for which are show below:
- (NSInteger) chart: (GRChartView *) chartView numberOfElementsForDataSet: (GRDataSet *) dataset;

- (double) chart: (GRChartView *) chartView yValueForDataSet: (GRDataSet *) dataSet element: (NSInteger) element;

- (NSColor *) chart: (GRChartView *) chartView colorForDataSet: (GRDataSet *) dataSet element: (NSInteger) element
These delegate calls are all pretty straightforward. If you only have one chart view and one dataset, you can just ignore the first two parameters. The first call tells GraphKit how many elements are in the data set, the second returns the value of the designated element while the third returns the wanted color.

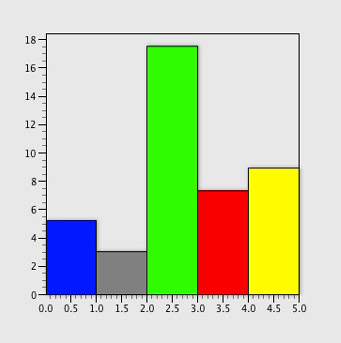
The GraphKit GRColumnDataSet class with line drawing turned on
You'll notice that my code decides what type of chart to display by returning the appropriate dataset class from the dataSetClass call. You can experiment with this by returning the other possible classes - I've listed them in the source code. You might also want to try turning the GRDataSetDrawPlotLine property on or off to see the effect in each case.
I've also included the header file for GRAxes, the class which encapsulates X and Y axis functionality. By default, the axes "float" according to the range of the supplied dataset, but (being a traditionalist) I wanted the Y-axis to start from zero.
My source code shows how to do this. If you find this article interesting and you do have more of those all-important key identifiers - used extensively throughout GraphKit - then let me know.
The full source code and demo project can be found here. The code was tested under Leopard, but GraphKit is also present on Tiger. ®