This article is more than 1 year old
How to catch a fraudster – using 'top cop' Benford and the power of maths
Nothing attracts 'unnatural' numbers like this smooth curve
Big Data's Big 5 Yes, we've been hit over the head enough times with the phrase "big data" to be aware of its presence, even though we've been up to our armpits in streams of huge unstructured datasets for years.
Those of you who are analysts or data scientists will have already picked up a set of tools that help you find hidden information buried deep in the data. Those tools may be languages (for example R), statistical tests (t-test, Analysis of Variance) and/or data mining techniques (clustering).
But there's a set of theorems, laws and simulations from the world of mathematics that can help you to solve more problems faster. As an added upside, you can increase your value - not that I am suggesting that a true artist, such as yourself, is concerned with anything as tacky as salary, of course.
The Reg has selected five such examples that we think are the most compelling for our purposes from the field of maths. Over the next few weeks we shall be looking at them from a high level to discover how they can potentially enhance and add value to what you do.
The five we will be looking at are:
- Benford’s Law: Numbers can be distributed in very unintuitive ways. Most fraudsters don’t understand that so their frauds can stick out like a sore thumb – as long as you know about Benford’s work.
- The German Tank Problem (and its solution): This can let you to estimate data that people don’t want you to have.
- Nyquist–Shannon sampling theorem: Now this does sound obscure because it is about the minimum sampling rate of a continuous wave, but in practice it will tell you how frequently you need to collect that big data from sensors like smart meters.
- Simpson’s paradox: If you don’t know about it, one day it will bite you.
- Monte Carlo simulations: One of the best and yet least-used tools in a data scientist tool box. They let you solve problems that probability calculations simply can’t touch.
For each one I’ll first give you a type of problem that can arise and then show you why the theorem helps to solve it. No difficult sums will be harmed in the making of this series.
Benford’s Law
So there you are, working with sales data and you have been given the job of detecting fraudulent transactions. A huge number of transactions are in the system and you have reason to believe that those originating from a particular country and credited to a particular sales person (J Smith) are fraudulent.
Your colleague: “OK, let’s check the mean and standard deviation of the transactions we suspect against those of the rest. Hmmm. No significant difference. Maybe we were wrong about poor old J Smith. She is kind to cats after all, she has about 12 rescued moggies that she looks after; perhaps we should look elsewhere for the evil perp.”
You: “Fair enough, but let’s do one more check. Take the value of all of the suspect transactions...
£23.65
£124.34
£8,321.45
£52,346.34
£8.45
... and select just the leading number from each value:
2
1
8
…
5
8
Then, count the number of ones, the number of twos and so on (up to nine) and plot these as a frequency distribution.”
Your colleague: “OK, if it makes you happy, but you owe me a pint if this doesn’t show anything.”
Later that same day.
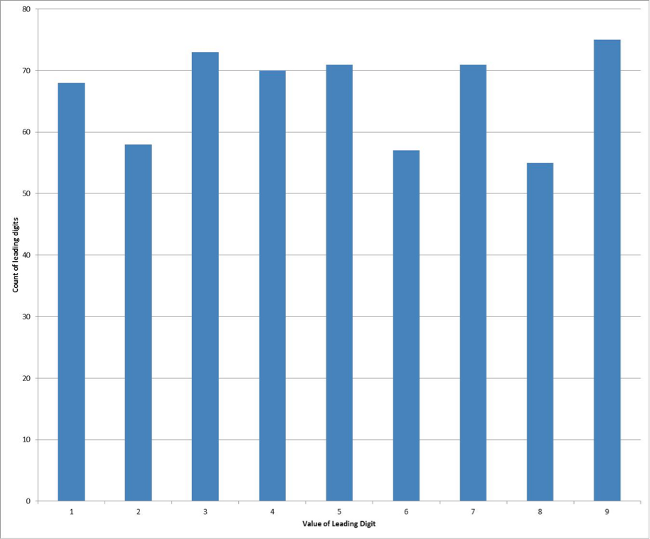
Your colleague: There is no pattern here, the distribution is essentially flat. So J Smith is off the hook and you owe me a pint.”
You: “Au contraire my fine colleague, we need to find new homes for those felines and you owe me a pint.”
J Smith is about to be banged to rights... because she’d never heard of Benford’s law.
Benford’s Law (AKA First-Digit Law)
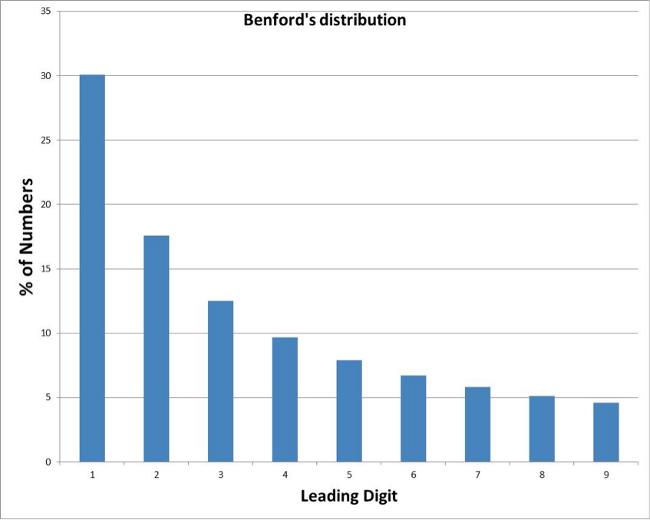
Benford comes to us courtesy of GE Research Laboratories physicist Frank Benford in the 1920s, who began looking into digital frequencies when he noticed his logarithm table books were unevenly worn. His law essentially says that the leading digits of numbers collected “from the wild” – real life – are not evenly distributed. Rather, they follow a predictable distribution where there are more ones than two, more two than threes and so on up to nine.
The differences are non-trivial. On average about 30 per cent of the numbers will start with a one, only about eight per cent with a five and a mere 4.6 per cent with a nine.
We would, of course, have to check the distribution of invoice totals from the same country credited to other sales people but I would confidentially expect those to follow a Benford distribution.
So, what is meant by “wild collected” numbers and why do we get such an odd distribution?
Wild collected numbers
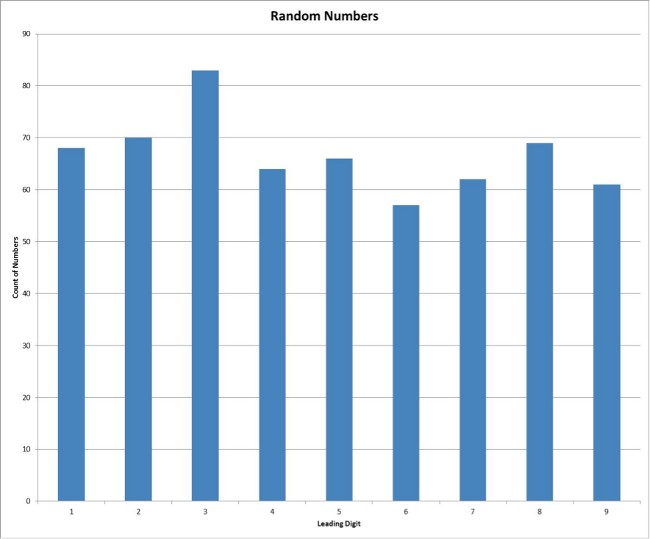
If you plot random numbers, they DO come out as a flat distribution. Here I have plotted the leading digit of around 600 random numbers.
Now you might think that numbers collected by actual observation of the real world (like the lengths of rivers, or their areas, or molecular masses of compounds or death rates or the heights of cities above sea level) would show the same distribution of leading integers, but in general they don’t; they show a distribution that approximates to a Benford distribution.
At this point you might be wondering if this is to do with the units in which you choose to measure, but no, this phenomenon is unit-independent. You can plot the leading digit of the height of each city above sea level in inches, feet, metres or cubits; it doesn’t matter, it still comes out as a Benford distribution.


