This article is more than 1 year old
OK Virtual Instruments, you've made a thing. Must you fill our ears with PR gobbledegook?
They've upgraded their network management tool - we think
Virtual Instruments has launched an "entity-centric solution" amid an unparalleled display of marketing verbiage.
The product is called VirtualWisdom, version 4.0. It's basically a network fabric sniffer with analysis smarts to help get networks working better. Originally it did Fibre Channel and then FCoE, but is branching out into Ethernet and calls itself an Infrastructure Performance Management (IPM) company for physical, virtual and cloud computing environments.
VirtualWisdom v4.0 has "a breadth and depth of metrics never before available" and a new Element View "taking intelligence beyond the IT with thousands of system-wide metrics", according to the PR flannel.
"Beyond the IT" and an "entity-centric solution" indeed. Who writes this stuff?
VW 4.0 (our acronym) can now run NAS monitoring on Ethernet using a new probe called ProbeNTAP.
We misread that at first and thought it was ProbeONTAP. We weren't that wrong - this "software-based storage probe leverages agentless APIs to capture and present health and utilisation statistics for NetApp storage arrays."
We'd guess other filer suppliers' products will be supported in the future.
"Underpinned by an analytics-focused database,” continues the VW release, “the new platform ingests millions of metrics per second and presents data significantly faster than before, making this the most powerful performance platform available on the market."
There is real-time visualisation of these through the GUI.
VW tells us that VW 4.0 has:
- Intelligent Topology to show the connectivity and relationship between network and network-using entities and gain a high-level understanding of resource utilisation, health and performance
- Case-based Alarms to help proactive infrastructure management. Users can view history and trending information to understand the frequency and urgency of alarms so they can take action before an issue becomes a fault
- Live Reports providing intuitive and dynamic visualisations of wire, machine, and analytic metrics dealing with performance, utilisation, and the health of devices and entities. They include bar charts, trend graphs, time-based comparisons and histograms at various levels of granularity
- Applied Analytics: analytics has been built into the platform to help customers deal with workload balancing, event investigation, trend correlation and similar problems across the environment
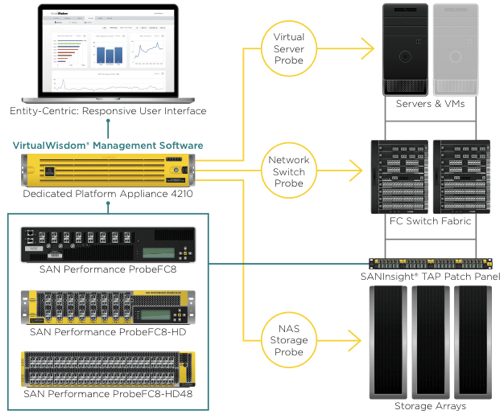
Virtual Wisdom 4.0 schematic diagram
The information it presents is useful to application, server and storage teams - according to VirtualWisdom, that is.
More information, including videos, can be found here. The product will be available by the end of May. ®
