This article is more than 1 year old
Google 'Transparency Report' shows rise in government groping
UK request numbers and success rates on a roller coaster
Google has released the latest update to its data detailing how often it is asked by law enforcement agencies around the world to cough up data about its users, and says company's “we’re … seeing more and more governments start to exercise their authority to make requests.”
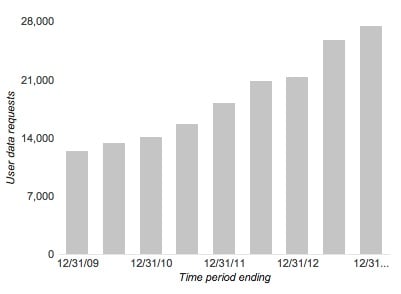
That quote comes from an post by Richard Salgado, the Chocolate Factory's legal director for law enforcement and information security. Salgado's headline figure is 120 per cent, the number by which he says government requests have risen since Google started publishing its data in 2009. That's partly because more governments are asking and also because the company has more users.
Google's highlighting the trend in government request growth over the period of its reports. Here's a look at the number of requests it has received since 2009.

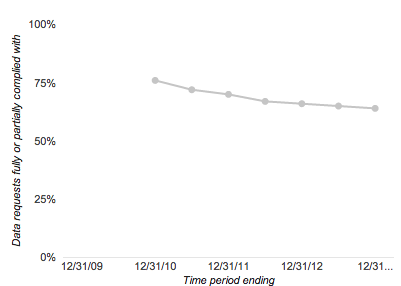
There's also the following, which Google seems quite proud of as it records a decline in the frequency of incidents in which it coughs up.

Google's posted data detailing the number of requests it receives here, in a 289-row spreadsheet that goes back to 2009. We've picked apart the spreadsheets to offer a little closer analysis of the four most Reg-reading nations.
Here's an interesting sample: data showing the UK's use of Google requests is not growing constantly, as is the case for most other nations.
Here's the UK's number of requests from 2009 to the new reporting period, 2013's second half.
| Period | Number of requests | Success rate |
|---|---|---|
| H2 2009 | 1166 | |
| H1 2010 | 1343 | |
| H2 2010 | 1162 | |
| H1 2011 | 1279 | 63 |
| H2 2011 | 1455 | 64 |
| H1 2012 | 1425 | 64 |
| H2 2012 | 1458 | 70 |
| H1 2013 | 1274 | 67 |
| H2 2013 | 1397 | 69 |
Might the decrease in query numbers but slight uptick in successful requests show that UK authorities learned that some types of request were futile? We'll let you discuss that interpretation of the data in the comments. To help you along, there's a larger table of UK, US, Canadian and Australian data below.
And spreadsheets await your downloading pleasure if you want to get more forensic. ®
| Period | Country | Legal Process | User Data Requests | % of successful requests | Users/Accounts Specified |
|---|---|---|---|---|---|
| H2 2009 | Australia | 155 | |||
| Canada | 41 | ||||
| United Kingdom | 1166 | ||||
| United States | 3580 | ||||
| H1 2010 | Australia | 200 | |||
| United Kingdom | 1343 | ||||
| United States | 4287 | ||||
| H2 2010 | Australia | 345 | 81 | ||
| Canada | 38 | 55 | |||
| United Kingdom | 1162 | 72 | |||
| United States | 4601 | 94 | |||
| H1 2011 | Australia | 361 | 73 | 412 | |
| 06/30/2011 | Canada | 50 | 48 | 75 | |
| 06/30/2011 | United Kingdom | 1279 | 63 | 1444 | |
| 06/30/2011 | United States | 5950 | 93 | 11057 | |
| H2 2011 | Australia | 444 | 65 | 496 | |
| Canada | 41 | 24 | 49 | ||
| United Kingdom | 1455 | 64 | 1764 | ||
| United States | 6321 | 93 | 12243 | ||
| H1 2012 | Australia | 523 | 64 | 841 | |
| Canada | 50 | 24 | 50 | ||
| United Kingdom | 1425 | 64 | 1732 | ||
| United States | 7969 | 90 | 16281 | ||
| H2 2012 | Australia | 584 | 65 | 711 | |
| Canada | 38 | 24 | 77 | ||
| United Kingdom | 1458 | 70 | 1918 | ||
| United States | Search Warrant | 1896 | 88 | 3152 | |
| United States | Subpoena | 5784 | 88 | 10390 | |
| United States | Other | 758 | 90 | 1249 | |
| H1 2013 | Australia | 645 | 64 | 807 | |
| Canada | 49 | 27 | 80 | ||
| United Kingdom | 1274 | 67 | 1818 | ||
| United States | Search Warrant | 2456 | 81 | 4281 | |
| United States | Subpoena | 7458 | 84 | 15770 | |
| United States | Wiretap Order | 7 | 100 | 7 | |
| United States | Emergency Disclosures | 119 | 81 | 175 | |
| United States | Pen Register Order | 207 | 89 | 332 | |
| United States | Other Court Orders | 671 | 69 | 1118 | |
| H2 2013 | Australia | 780 | 70 | 944 | |
| Canada | 52 | 25 | 75 | ||
| United Kingdom | 1397 | 69 | 3142 | ||
| United States | Search Warrant | 2537 | 81 | 4180 | |
| United States | Subpoena | 7044 | 84 | 11999 | |
| United States | Wiretap Order | 11 | 100 | 11 | |
| United States | Emergency Disclosures | 153 | 78 | 217 | |
| United States | Pen Register Order | 140 | 90 | 259 | |
| United States | Other Court Orders | 689 | 75 | 1588 |
