This article is more than 1 year old
Supercomputer charts killer tsunami's course
NOAA simulates destructive waves
The US National Oceanographic and Atmospheric Administration (NOAA) has run simulations that show how the tsunami triggered by last Friday's 9.0 Miyagi earthquake in northeastern Japan propagated across the Pacific Ocean.
It took a huge amount of energy to create what is now known as the Honshu tsunami, named for Japan's largest island, where Miyagi Prefecture is located along with Tokyo and the stricken nuclear power plants at Fukushima – and the massive movement of the Pacific plate pushing under the North American plate in the subduction zone off the coast supplied enough energy to shake up the entire ocean.
US Geological Survey seismologist Paul Earle told AFP that in his estimation, the Pacific plate on which Honshu sits – and which normally moves 3.3 inches per year – thrust about eight feet eastward under the North American plate during the earthquake. USGS geophysicist Kenneth Hudnut confirmed that estimate to CNN.
The quake off Honshu was literally earth-shattering, but it was the tsunami that proved to be far deadlier, as was the case in the Indonesian earthquake in December 2004, which was rated at 9.1 and which was estimated to have killed up to 300,000 in a devastating tsunami.
To get a sense of how the Honshu tsunami traversed the Pacific, NOAA took real-time data from the Deep-ocean Assessment and Reporting of Tsunami (DART) system, which rings the Pacific Ocean as well as a few spots in the Indian Ocean and the Atlantic, and pumped the bobbing-bouy data into a tsunami-modeling program called MOST – Method of Splitting Tsunami. This model only needs to simulate water motion on a large scale in the deep ocean, but requires much finer-grain modeling close to the shore, where the wavelengths between tsunami waves shorten and the waves get higher.
You can check out the MOST simulations of the Honshu tsunami here. You can also see an animation with voiceover by Eddie Bernard, director of the Pacific Marine Environmental Laboratory at NOAA, here.
According to NOAA, it took 25 minutes for the first DART buoy to feel the tsunami, and the MOST model was accurate to about 2.5 per cent compared with what actually happened to the DART buoys in the real world, with waves hitting the Hawaiian Islands and the U.S. from 3 to 15 minutes later than forecast. This is good, since the other way around could be deadly. The MOST model was used to send out tsunami-warning alerts around the Pacific Rim.
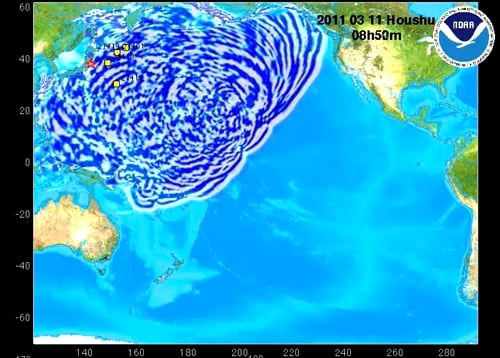
MOST modeling of the pattern of tsunami waves just under nine hours after the quake struck
The waves were just passing Hawaii at the time indicated in the simulation above, and you can see the interference patterns caused by the churning ocean bouncing off underwater ridges, mountains, and volcanoes as well as coastlines, and reflected back out to meet the oncoming waves. After 22 hours, the waves had completely stirred up the entire Pacific Ocean.
To get a better sense of the energy propagation from this complex wavefront, NOAA took the DART data and created a maximum-amplitude plot using the MOST model:

The force of the Honshu tsunami was felt throughout the Pacific (click to enlarge)
In this color-coded chart, purple shows where severe forces and high waves were triggered by the energy released by the sliding Pacific plate, with red being slightly less energetic and black being very bad indeed.
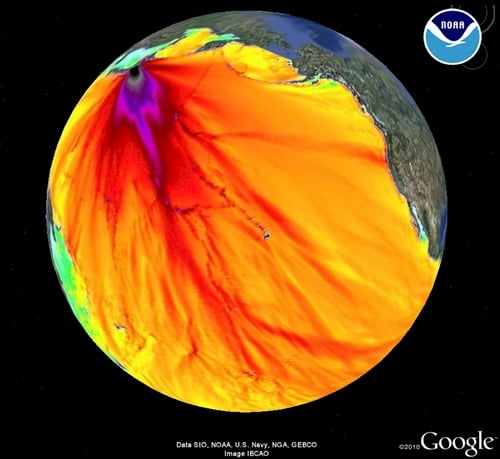
Here's what the force model looks like if you wrap it around Google Earth
The black areas in the chart show where waves were more than 240 centimeters (7.9 ft.) above normal sea level. That rather frightening figure, however, is actually worse than it sounds: it represents the depth of the waves offshore – when they came onshore and hit the shallow beaches, they got taller and wreaked havoc far inland. In the case of the Honshu tsunami, the destruction extended as far as six miles inland.
Estimates of the death toll from the Miyagi earthquake and the Honshu tsunami now range from 10,000 to 15,000 – but imagine how much more awful the loss of life would have been without the DART system and tsunami warnings. And still, as was the case in the Indonesian quake seven years ago, sometimes there is not enough warning and not enough high ground to run to. ®
