This article is more than 1 year old
A race to the finish
Pert, critical path or crawl to the line?
Project management Would you run 145 miles from Birmingham to London non-stop for fun? Of course not, but most years about 80 “ultra” runners do just that. They share the loneliness of the long distance project manager.
These brave souls running the Grand Union Canal Race risk exhaustion and collapse on some lonely stretch of canal but most of them complete the course in times of between 33 and 40 hours. Britain’s longest, and some say toughest, running race is a good analogy for most projects. Entrants discuss at length their game plans – what to eat and drink, how many stops to take, what support to call on, how to cope with stress, and so on. And of course they meet unforeseen circumstances, from getting lost to nipple rash.
The average project manager (PM) can probably relate to the problems of the typical Grand Union Canal Race competitor (if not the rashes). And like these runners, PMs try as hard as possible to build robust plans to reach the objective.
For the past 50 years or so, the question has been what is the best way to model any complex activity – and whether you need specific software to do it.
Though less favoured than in its heyday, Pert (program evaluation and review technique) and the critical path method (CPM) remain cornerstones in project modelling. Pert was invented by a couple of US Navy bigwigs in 1957 to manage nuclear submarine maintenance. Subsequently it was used on huge projects such as the Grenoble Winter Olympics. CPM, developed slightly earlier, is seen as the forerunner to Pert and is sometimes amalgamated within it.
Pert is best known for its network charts, derived from the raw data about all the activities to be undertaken. The chart acts as a metaphor for the flow of time (left to right) and provide an easy visual indication of the dependencies between activities.
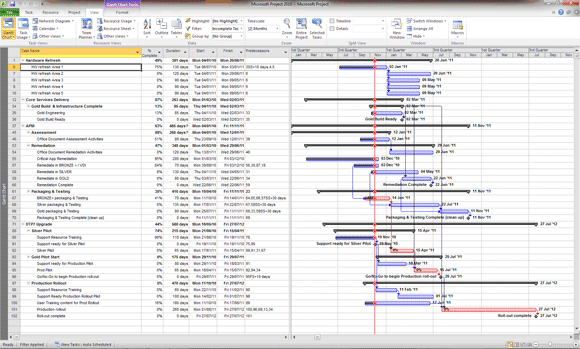
Project plan: the stuff in red is the critical path.
Like our canal runners, the PM’s number one obsession when embarking on a project is estimating total duration. How fast can we go?
Pert’s primary deliverable, calculated automatically from the raw data, is the so-called critical path, or the minimum time needed to complete the project, and the listing of linked activities in that minimum path. Once the critical path is calculated, earliest and latest start and finish times for non-critical activities also fall out, and the implications for resourcing and scheduling.
Typically, you number activities or events sequentially (10, 20, 30...), allowing for later additions if needed. An event on the Pert chart is a block, linked to other events in the correct sequence, setting out the order in which events unfold.
The raw data consists of the activity name, and optimistic, pessimistic and expected durations. Different calculation methods may be used to estimate a duration time. Microsoft Project, for example, uses a weighted average from which the critical path is derived.
Once this is done “slack” (or “float”) becomes evident in those activities not on the critical path. Slack is the length of time an activity can be delayed without affecting the critical path.
The Gantt chart displays the critical path, colour-coded. The simplicity of the Gantt chart, and the clarity with which it shows the flow of time, makes it the preferred and primary chart on many projects. Change the data, and the critical path and the Gantt charge change too.
